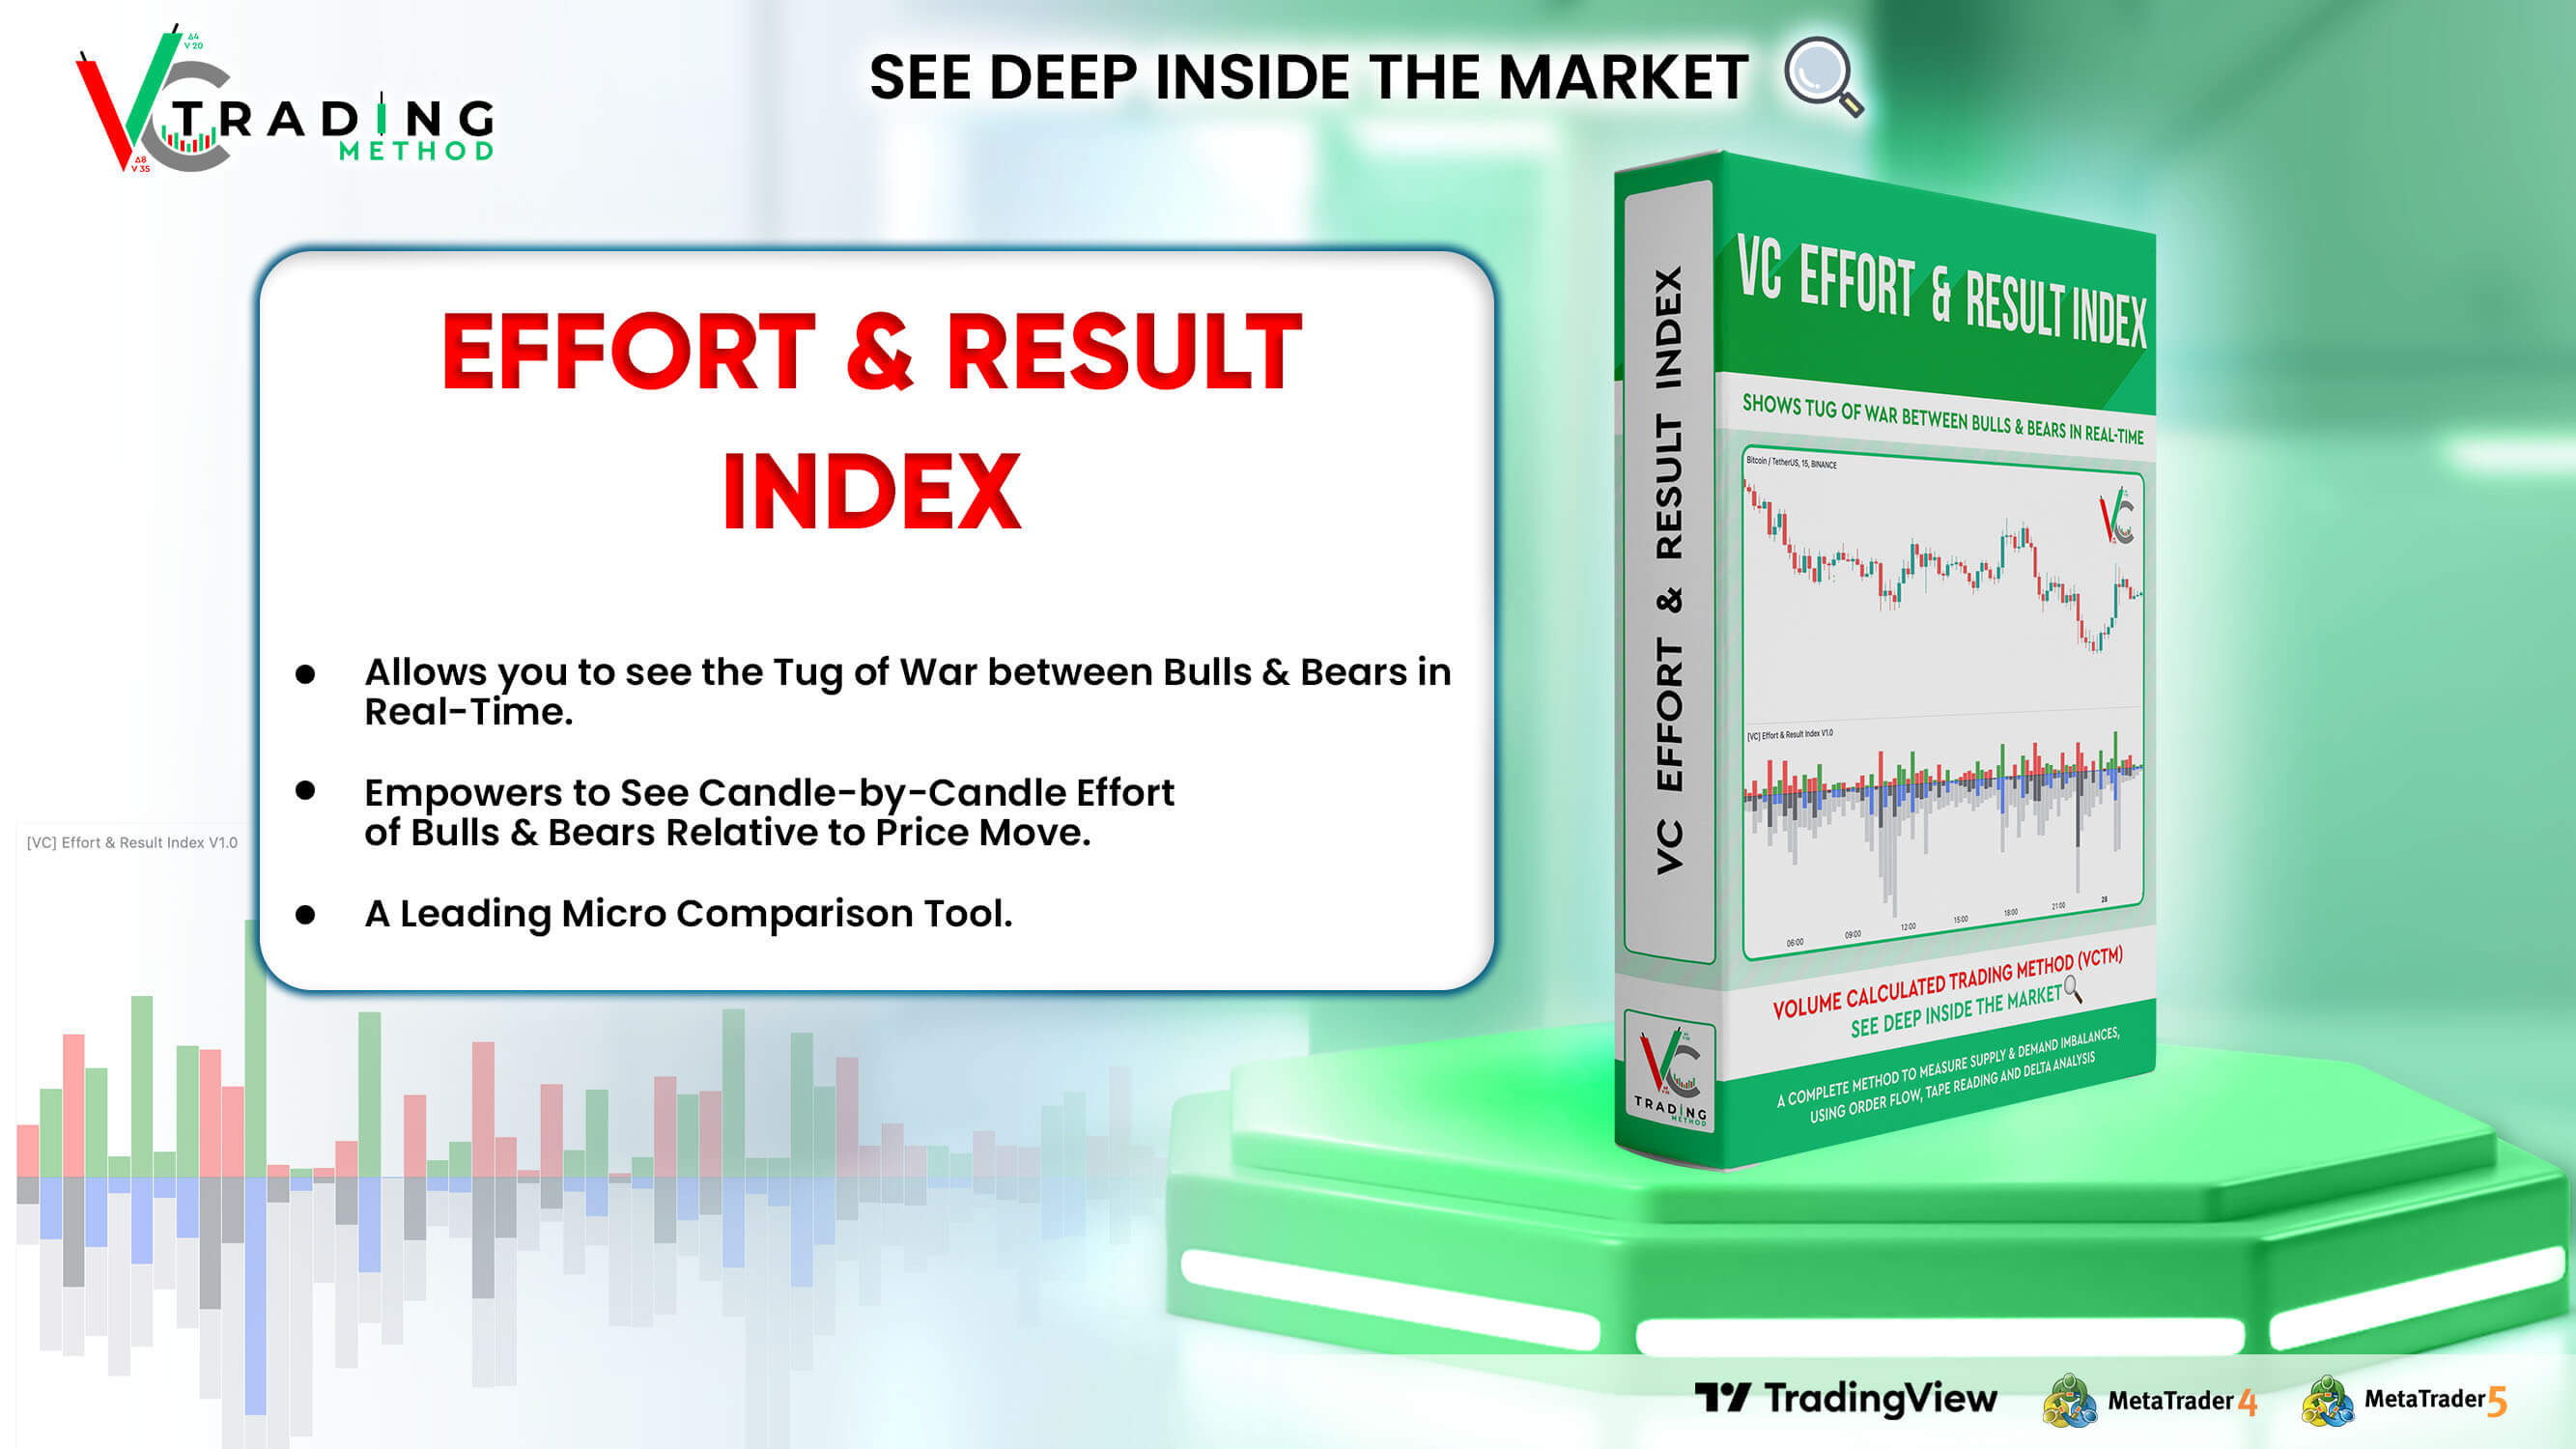
V.C. Effort & Result Index draws the
Price change, Volume , Delta &
Delta % as a histogram. On the positive side of the histogram, it marks the price change &
on the negative side of the histogram, it marks
volume , delta & delta %. And the best part of
the indicator is that it allows you to see all the mentioned data types simultaneously.
See the below chart for a comprehensive understanding.
Before moving further, understand the below analogy first.
Volume & Delta = Fule or Effort
Price Movement = Result
Think of Volume
& Delta as FULE or EFFORT and Price Movement as Result.
If the price travels a significant distance with less fule & effort, it indicates that no barriers
or inverse forces are stopping the price movement.
On the other hand, if the price is travelling a less distance & consuming comparatively more fule
& effort, it indicates some barriers or inverse forces stopping the price movement.
V.C. Effort & Result Index empowers you to read, compare & analyse
Volume , Delta & Price
effortlessly. It helps to measure the relative price change in different combinations. Such as, you can
compare the price change with total
volume , delta
volume & delta percentage.
See the below relative comparison analysis by using Price Change, Volume Change & Delta Change.
In the above example, you can see that on candle A, there is a very significant price move with a small
volume & delta. But on
the next candle B, there is a minor price move compared to the previous candle A, but the
volume is relatively high
& delta is almost the same. In simple words, the same effort was applied to candle B but got fewer
results than candle A. It indicates that buyers applied the same effort but failed to get the same results.
It reveals that sellers are taking control, leading to a trend reversal.
This comparative analysis method & approach can add an extra edge to your analysis spacially on key
levels & breakouts.
V.C Effort & Result Index Settings & Inputs
Price Change:
Allow you to show/hide the price change bars on the positive side of the histogram.
Volume:
Allow you to show/hide the total
volume on the negative side of the histogram.
Delta%:
Allow you to show/hide the delta % on the negative side of the histogram.
Delta:
Allow you to show/hide the delta on the negative side of the histogram.
Style Settings
The Style section allows you to change the colors & the view format of all data types.
