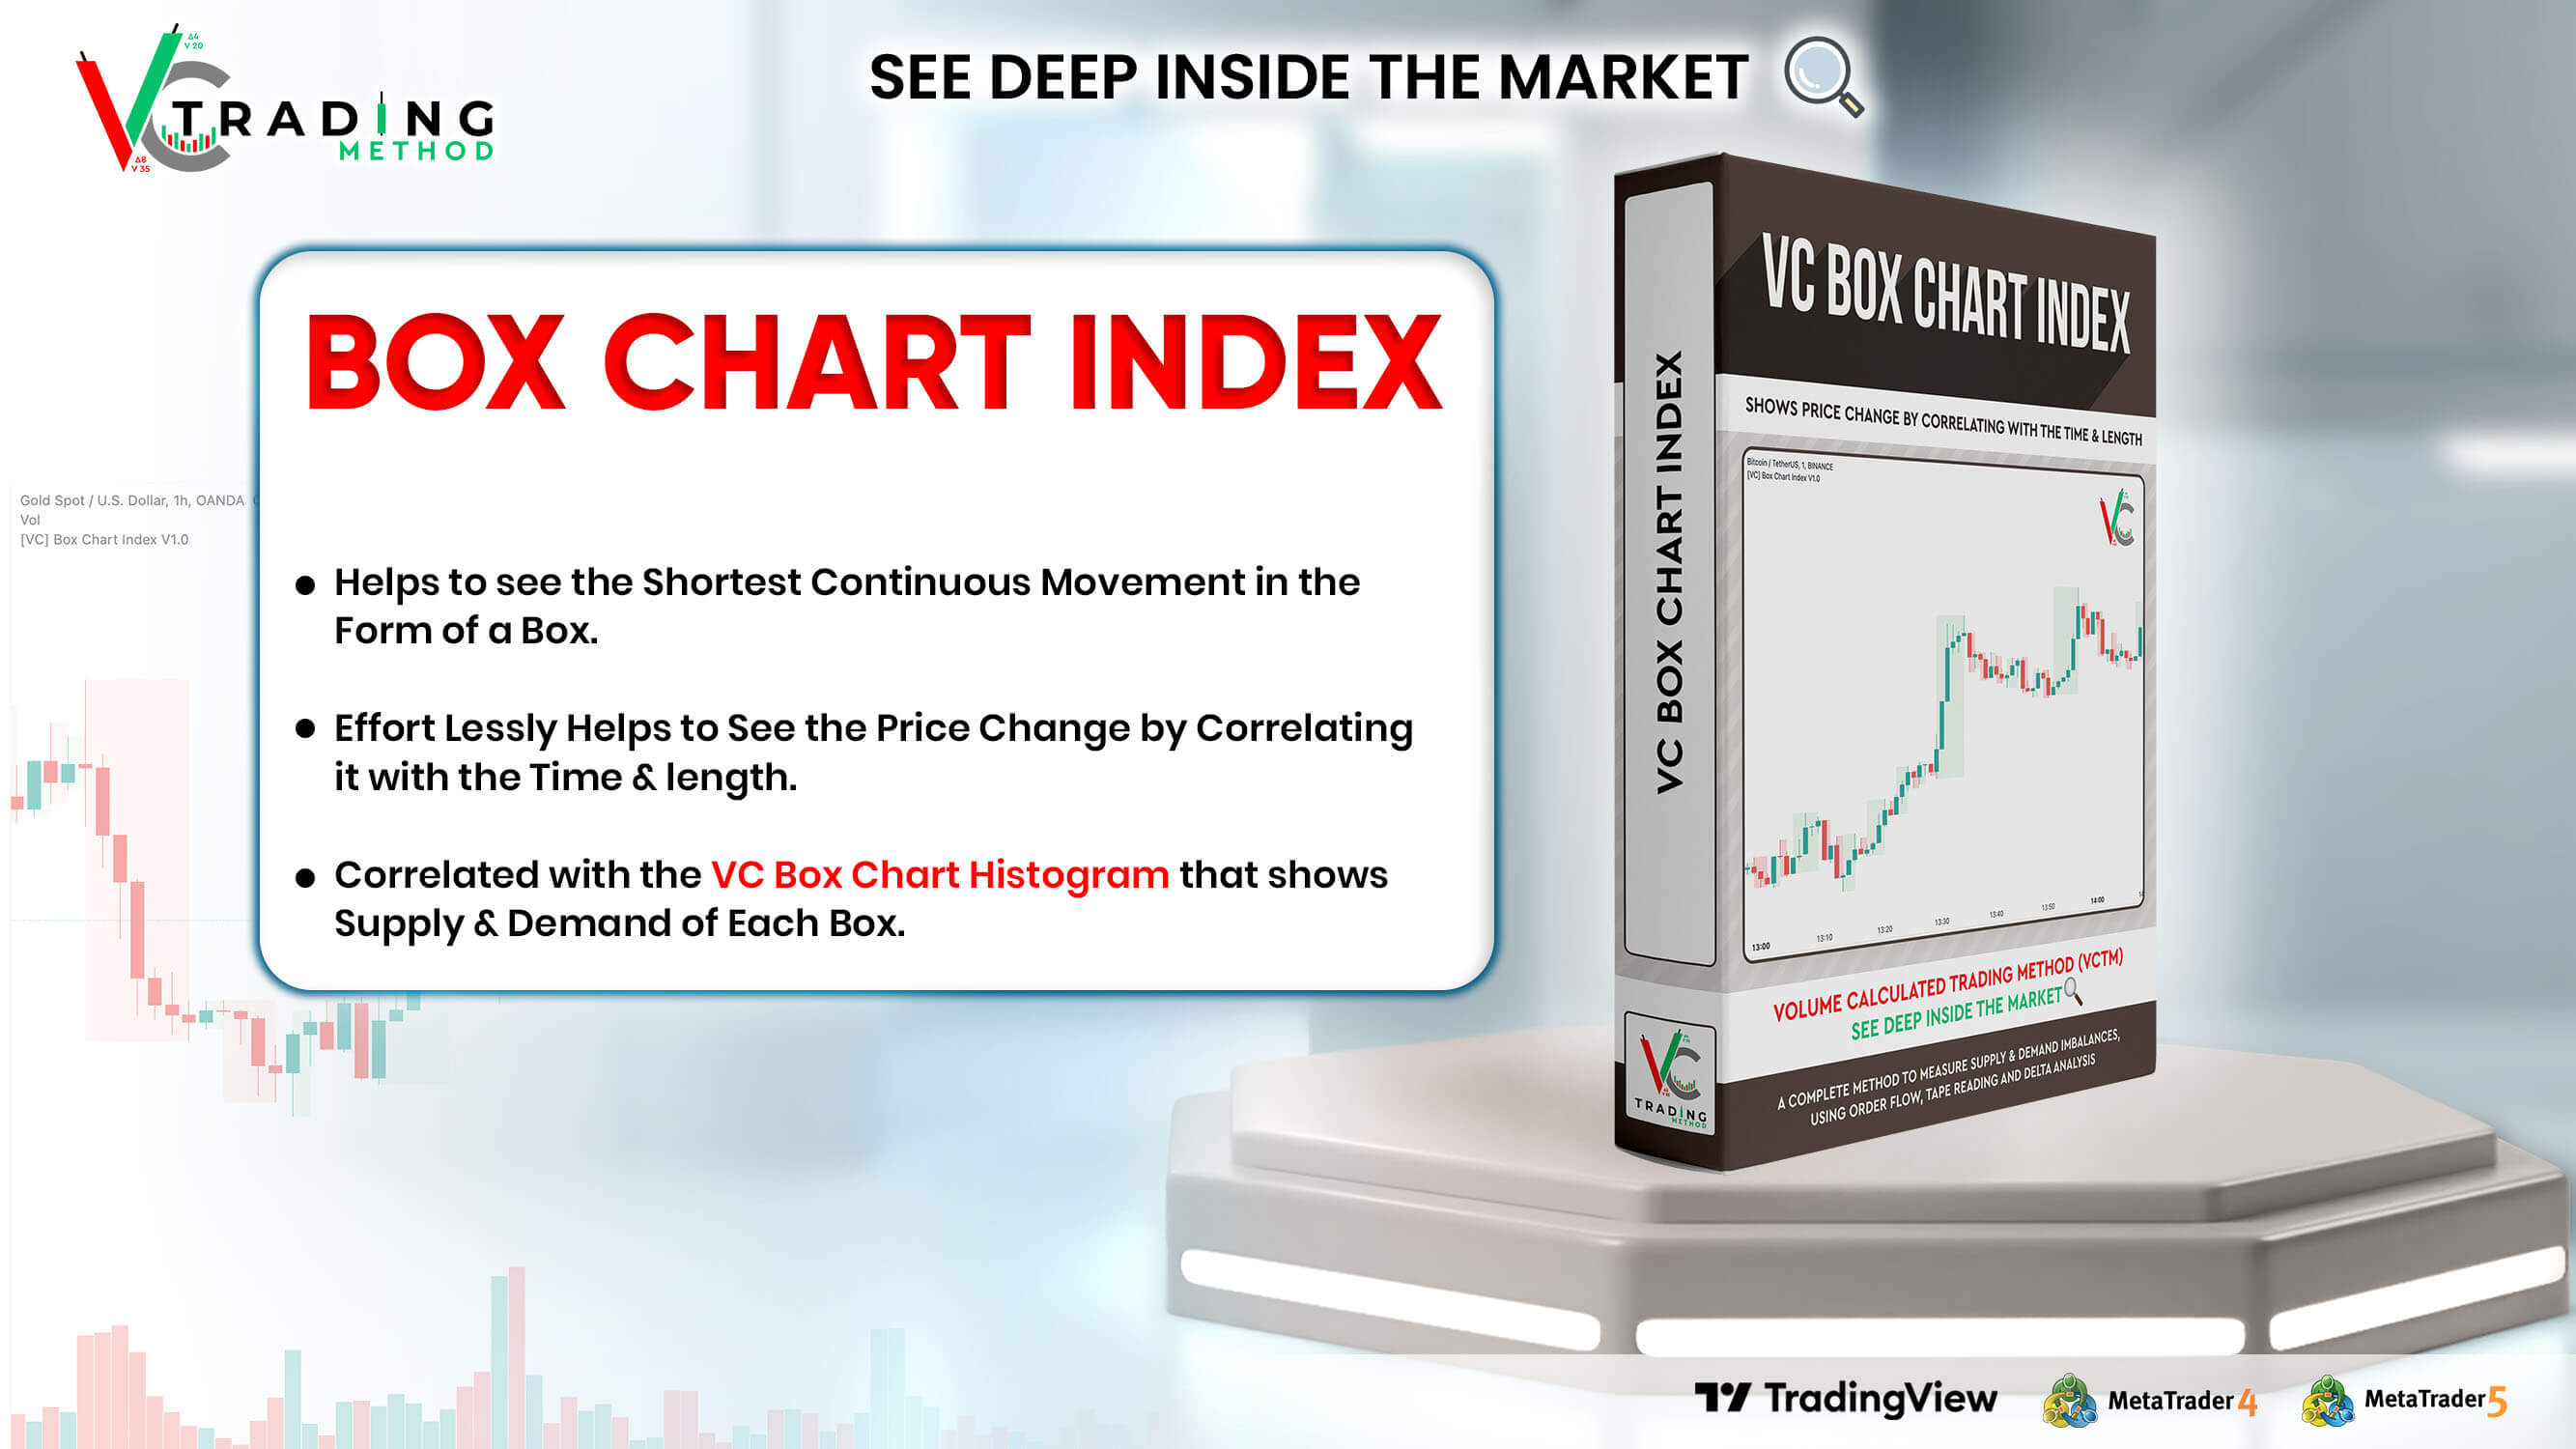
The
''V.C Box Chart Index'' shows the
shortest possible wave. It graphically shows the continuous up movement or continuous down movement in
the form of a box. As soon as the direction changes, the box changes as well.
It is an effortless way to show the price change that occurred in the box visually. It also correlates
to what Wyckoff said about as the buying waves increase in
volume , time, and length & the selling
waves shorten, lookout for a change in the prevailing trend.
The example below shows more big green boxes than red, and the price change caused by the green box has
made the uptrend.
Important Note:
V.C Box Chart Index also correlates to another indicator named
V.C Box Chart
Histogram
V.C Box Chart Histogram draws the cumulative delta based on each box as a histogram. Combining these two
indicators empowers you to see the cumulative demand & supply and buying & selling quantity of
each box.
See the Example Blow:
The above example shows that supply is decreasing on down boxes, indicating that fewer sellers are left
to pull the market down.
On the other hand, demand increases on the up boxes, indicating that more buyers are coming into the
market. As a result, every green box is breaking the previous high & price is moving upside.
For a more comprehensive understanding of the co-relation of these two indicators, read the
description from the link below.
V.C Box Chart Index Settings & Properties Explained
Border of Box:
Allow you to show/hide the border of the box
Positive Box & Negative Box Borders:
Allow you to change the border color & opacity
Positive Box & Negative Box:
Allow you to change the color & opacity of the box

![[VC] Box Chart Histogram V1.0](https://s3.tradingview.com/p/P0i81CEx_big.png)